I. China"s Overall Bus Export Market
According to sources, in the first four months this year, China exported 25,329 buses, up by 46.16% year on year, valued at 762 million USD, up by 34.91%. Iraq is the No.1 export destination with 4,492 buses, up by 379.11% over the same period last year. In terms of export volume and export value, Bolivia ranked the first, which saw 751.52% and 369.41% year-on-year growth respectively.
China"s Top Ten Export Destinations from Jan. to Apr., 2014
|
Export Destination |
Volume (Unit) |
Value (USD) |
||||
|
Apr. |
Jan. - Apr. |
Growth Rate (%) |
Apr. |
Jan. - Apr. |
Growth Rate (%) |
|
|
Iraq |
500 |
4,492 |
379.11 |
6,450,000 |
35,344,681 |
208.14 |
|
Egypt |
1,355 |
4,128 |
3.23 |
9,454,310 |
21,992,915 |
-2.95 |
|
Nigeria |
30 |
1,797 |
101.8 |
372,350 |
23,744,838 |
169.71 |
|
Peru |
402 |
1,530 |
-9.54 |
5,134,108 |
22,907,119 |
-42.67 |
|
Vietnam |
384 |
1,317 |
118.1 |
6,975,922 |
17,707,906 |
109.73 |
|
Angola |
418 |
1,231 |
500 |
8,017,480 |
19,212,143 |
139.92 |
|
Venezuela |
315 |
998 |
- |
27,130,437 |
103,679,940 |
- |
|
UAE |
316 |
854 |
304.74 |
7,042,507 |
13,693,742 |
55.19 |
|
Bolivia |
313 |
562 |
751.52 |
3,046,400 |
5,603,313 |
369.41 |
|
South Africa |
207 |
420 |
-42.86 |
5,097,180 |
8,094,322 |
-9.89 |
II. Analysis on Performances of Top 50 Bus Enterprises in their Export from Jan. to Apr., 2014
According to Chinese Bus Statistical Information Network, the nation"s top 50 large- and medium-sized bus enterprises exported 2,899 buses in Apr. In the first four months, the combined export volume of the 50 bus makers reached 11,111 units, up by 23.37% year on year.
Top Ten Bus Exporters 2014
|
Enterprises |
Volume Apr. |
Volume Jan. - Apr. |
Volume Jan. to Apr., 2013 |
Growth Rate (%) |
|
King Long |
740 |
3,797 |
2,957 |
28.4 |
|
Golden Dragon |
935 |
2,360 |
2,390 |
-1.26 |
|
Yutong |
321 |
1,673 |
1,197 |
39.8 |
|
Higer |
498 |
1406 |
838 |
67.8 |
|
Zhongtong |
51 |
369 |
402 |
-8.2 |
|
Sunlong |
35 |
229 |
191 |
19.9 |
|
Asiastar |
44 |
165 |
125 |
32.0 |
|
Guilin Bus |
48 |
163 |
122 |
33.6 |
|
Foton |
21 |
121 |
33 |
266.7 |
|
FAW Wuxi |
100 |
102 |
1 |
10100 |
|
Total |
2793 |
10385 |
8256 |
25.8 |
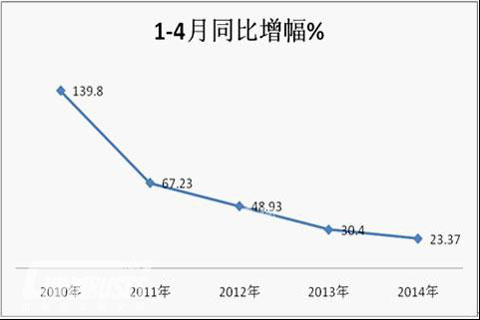
III. Analysis on China"s Bus Makers" Export (Jan. to Apr.) from 2010 to 2014
China"s Bus Makers" Export (Jan. to Apr.) from 2010 to 2014
|
Year (Jan.-Apr.) |
2010 |
2011 |
2012 |
2013 |
2014 |
|
Growth Rate (%) |
139.8 |
67.23 |
48.93 |
30.4 |
23.37 |

From the table, it can be seen that the export"s growing momentum of China-made buses has seen several nosedives in the first four months from 2010 (growth rate: 139.8%) to 2014 (growth rate: 23.37%). More alarmingly, the bus export market was diminishing during the past few years and the domestic bus market has been growing more dependent on domestic demand.